On Friday Google announced a security improvement for Chrome 25, indicating that all searches would be sent over a Secure Socket Layer (SSL) connection. While this change means nothing new for users signed into Google who’ve already been protected via safe search, it does mean additional security for those not signed in while using Chrome, now the world’s most widely used browser. When users search from the address bar, their queries will now also be sent over HTTPS.
Users may not notice this difference, but for marketers, this change may lead to some frustration, as less data from search will be available freely through Google Analytics. The amount of “Not Provided” data in analytics reports will more than likely increase as it is mostly data that is not provided due to privacy protection and data encryptions from secure browsers, like Chrome.
This lack of search data, most importantly keywords, can make it hard for marketers using Google Analytics free services to see the keywords bringing users to their online content. If you begin to observe this lack of data, it may be time for you to get comfortable with a few other analytics tools to continue to improve your website and increase conversions without relying solely on keywords.
In-Page Analytics
The In-Page Analytics feature is available under the Content section on the Standard Reporting tab. This feature lets you visually assess how users interact on your website. It’s important to note that this feature does not show results for inbound or outbound links. Your data shown can help you decide if your call to action is motivating or visible enough, if users are finding what they’re looking for, and what content is most popular.
Each link on every page will show a percentage of clicks over a selected period of time. Using these numbers, it should be easy to see any content with very few or no clicks — a sure sign that copy or images should be updated. Additional percentages will be shown for clicks that happen below the fold. If a majority happen in the lower portion of your website, a consideration for a website redesign may be necessary.
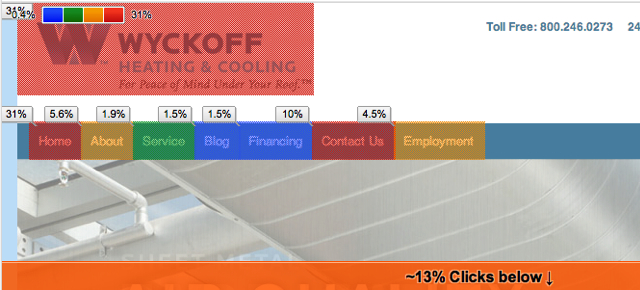
This is even more important after Google announced last year that search results would be affected positively for websites with visible content above-the-fold, a public emphasis on the importance of positive user experiences.
Using Bounce and Exit Rates
To understand the importance of exit and bounce rates, it’s important to first understand the difference between these metrics. Let’s start with exit rate. For all pageviews on your website, the exit rate shows the percentage that one page was the last page viewed for users. A high percentage is good when users are leaving your website after viewing your most important content or after completing your desired call to action, such as a purchase or a form submission.
As for bounce rate, the percentage shown represents the amount of visits and exits that happened on a single page. A high percentage can lead to a bit of deduction to determine whether it’s good or bad. A page receiving high visits and high bounce rates can show that users are quickly finding the content they need from search, and leave because they are satisfied. Alternatively, this could also mean that users are coming to a page and leaving — possibly due to poor search results or slow load times.
When you see a high bounce-rate percentage, it’s important to look again at that page’s content and ask yourself why this could be happening. A good way to get to the bottom of this is by looking at the average time spent on the page — is it consistent with how long it would take for a user to read or interact with your content? If yes, you may be in the clear.
Testing These Tools
While the above tools may give you great insight on the actions users are taking on your website, they don’t tell you directly what to change to improve those numbers. As marketers, a key piece of the job is to continue to try new layouts, designs, and copy. Consider using a set period of time to run a few tests with changes you believe could lead to better results. Continue to monitor user behavior as well. If results improve, keep the changes. If they worsen, change them back.
Too nervous to make these changes on a live site? Test new layout designs at fivesecondtest.com. You can choose a variety of usability tests that will give you feedback from real users on first impressions, the success rate of your call to action, and more.
If all else fails, consider taking the paid leap to Adwords. As of now, keywords data is still available to paid users.